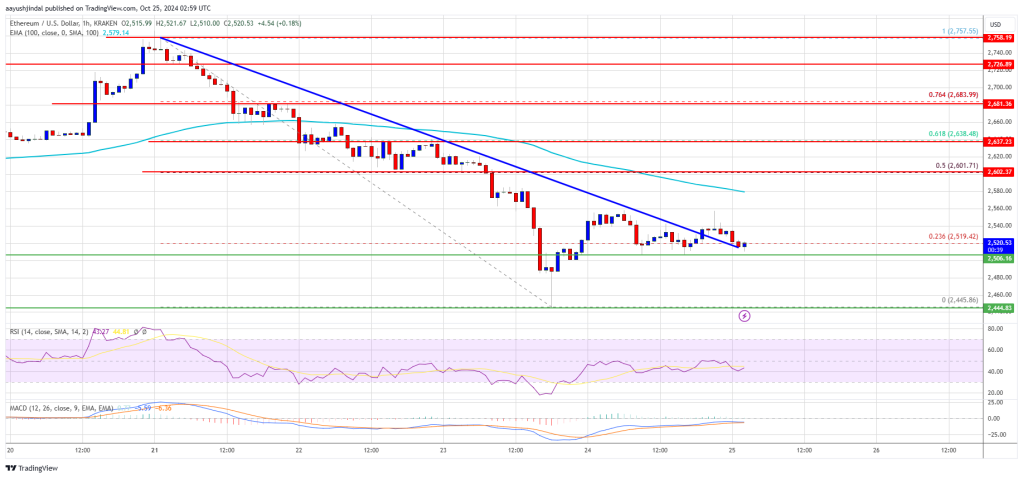
Ethereum’s price has been on a rollercoaster ride, dipping below the $2,450 support level before making a slight recovery. However, the digital currency is struggling to break above the $2,550 mark and regain its momentum.
- After hitting a low of $2,445, Ethereum initiated a recovery phase from the $2,450 zone.
- Currently, the price is trading below $2,560 and the 100-hourly Simple Moving Average.
- A positive development was the breach of a crucial bearish trend line with resistance at $2,540 on the hourly chart of ETH/USD (data feed via Kraken).
- If the pair manages to surpass the $2,580 and $2,600 resistance levels, it could spark a fresh uptrend.
Ethereum Price Shows Signs of Recovery
Ethereum’s price plummeted below the $2,550 level, mirroring Bitcoin’s decline. However, ETH has since rebounded from its low of $2,445.
The price breached the $2,500 mark and surpassed the 23.6% Fibonacci retracement level of the recent downward swing from $2,760 to $2,445. Additionally, a key bearish trend line at $2,540 was broken on the hourly ETH/USD chart.
Despite the recovery, Ethereum is currently struggling to breach the $2,560 level and the 100-hourly Simple Moving Average. The immediate hurdle lies around $2,580, followed by a major resistance at $2,600.

A breakthrough above the $2,600 resistance could propel Ethereum towards $2,650, signaling a potential uptrend. Further gains might see ETH target the $2,750 resistance zone.
Potential Downside for ETH
If Ethereum fails to surpass the $2,560 barrier, it may experience another downward trend. Initial support is at $2,505, followed by a major support level near $2,485.
A decisive drop below $2,485 could push the price towards $2,450, with further losses potentially leading to a test of the $2,420 support level. The next critical support zone lies at $2,340.
Technical Indicators
Hourly MACD – The MACD for ETH/USD shows waning bullish momentum.
Hourly RSI – The RSI for ETH/USD has dipped below the 50 mark.
Major Support Level – $2,500
Major Resistance Level – $2,580

