The Current State of Ethereum’s Price
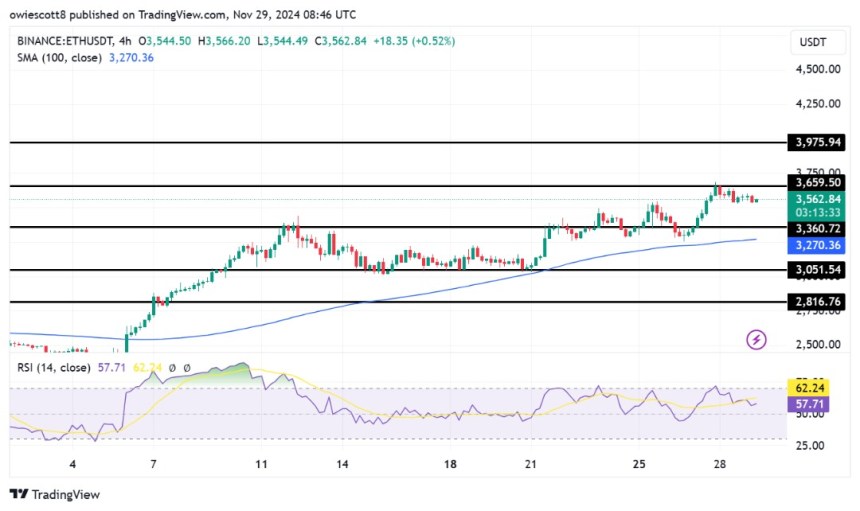
Ethereum is currently facing a major challenge at the $3,659 resistance level, with its momentum showing signs of slowing down. Following a period of steady growth, the cryptocurrency has entered a consolidation phase, where bulls are struggling to push the price higher. This pause in the upward movement has raised concerns about whether Ethereum’s rally is losing steam or preparing for its next significant move.
Analysis of Ethereum’s Price Trends
On the 4-hour chart, Ethereum is experiencing strong bearish momentum as it approaches the $3,360 level and the critical 100-day Simple Moving Average (SMA). The outcome at this key level will determine the next direction for the price – a bounce back if successfully defended or further decline if broken. Additionally, the Relative Strength Index (RSI) has dropped to 56%, signaling a decrease in buying pressure and a possible shift in market sentiment towards consolidation or reversal.

Implications for Ethereum’s Future
Despite hovering above the daily 100-day SMA, Ethereum is showing bearish signals with a downward trend towards $3,360. This movement implies dominant selling pressure, weakening the bullish momentum. A break below $3,360 could lead to further losses, signaling a deeper pullback in the market. The 1-day RSI also indicates increasing negative pressure on Ethereum, with sellers gaining dominance as the signal line approaches the 50% threshold.
Support and Resistance Levels to Watch
The $3,360 level is crucial as historical support for Ethereum. Holding above this level could trigger a rebound towards the $3,659 resistance. However, failing to maintain above $3,360 may result in a significant downward movement, with $3,051 as the next key support range. A break below this level could lead to further declines targeting lower support zones.
Overall, Ethereum’s price movements are at a critical juncture, with key support and resistance levels dictating its future trajectory. Traders and investors should closely monitor these levels to gauge the market sentiment and potential breakout scenarios.
Featured image from Unsplash, chart from Tradingview.com

